[Performance Speedup] Customizing GraphQL Tracing on NewRelic
At PicCollage, one of server team's goals for the following three months is optimizing the performance of our API services. To do optimization, our step one is to identify "what" should be optimized, among those numerous endpoints that the API provides. We can't fix a problem if we can't find it, of course.
PicCollage uses NewRelic as the performance monitor for our Ruby on Rails API service. It makes life easier for us to go about our optimization mission. With NewRelic, we get real-time metrics (throughput, response time, etc,..) on different transactions, which can even be broken down to components for us to see what processes are the most time-consuming. In two words: it helps.
Except that it didn't. As you may have already guessed (from the title), it has to do with GraphQL. Currently PicCollage API comes in both REST and GraphQL (see our articles on GraphQL). Due to the dynamic nature of GraphQL (in terms of query composition) and how NewRelic breaks down transactions, all requests coming through GraphQL API will be filed as one big /grahql route by default, whereas requests that come through REST API are nicely grouped by endpoint. When it comes to per-route performance analysis, the GraphQL routes become a headache.
 Again, as you may have already guessed (by the existence of this post), we have a solution for it. In the next sections I'll walk you through the two approaches you are encouraged to try, with code examples and real, just-out-of-the-oven NewRelic screenshots.
Basic Info
- Our goal is to separate different GraphQL queries into different routes on NewRelic.
- We use Ruby on Rails, and GraphQL Ruby for our GraphQL API.
- graphql-ruby provides a built-in NewRelic agent plugin, which we are also using. Below is our Schema before any changes.
class RootSchema < GraphQL::Schema
  # ...(omitting unrelated part)

  use GraphQL::Tracing::NewRelicTracing
There are two (reasonably feasible) ways to achieve our goal. The first is a one-liner solution, but with some limitations. The second requires more code, but you'll get tailor-made results in return. I say it's worth the trouble.
bonus: I also ended up setting a custom attribute that records the full query on the report. It's another nuisance of NewRelic that's finally out of the way!
Tracking GraphQL Performance by Query: The One Liner
The almighty graphql-ruby library gives us a convenient option in its integration with NewRelic. GraphQL has a concept called operation name for queries. Below is a quick example.
# operation without a name
query {
  ...
}

# operation with a name (i.e. a named operation)
query TheName {
  ...
}
If the queries that comes to you are already named operations, or if somehow you can make them so–congratulations! Pass in an optional argument (as shown below) and you shall read no more. set_transaction_name will tell the NewRelic agent to separate transactions by operation names.
class RootSchema < GraphQL::Schema
  # ...(omitting unrelated part)

  # Pass in the optional argument `set_transaction_name`
  use GraphQL::Tracing::NewRelicTracing, set_transaction_name: true
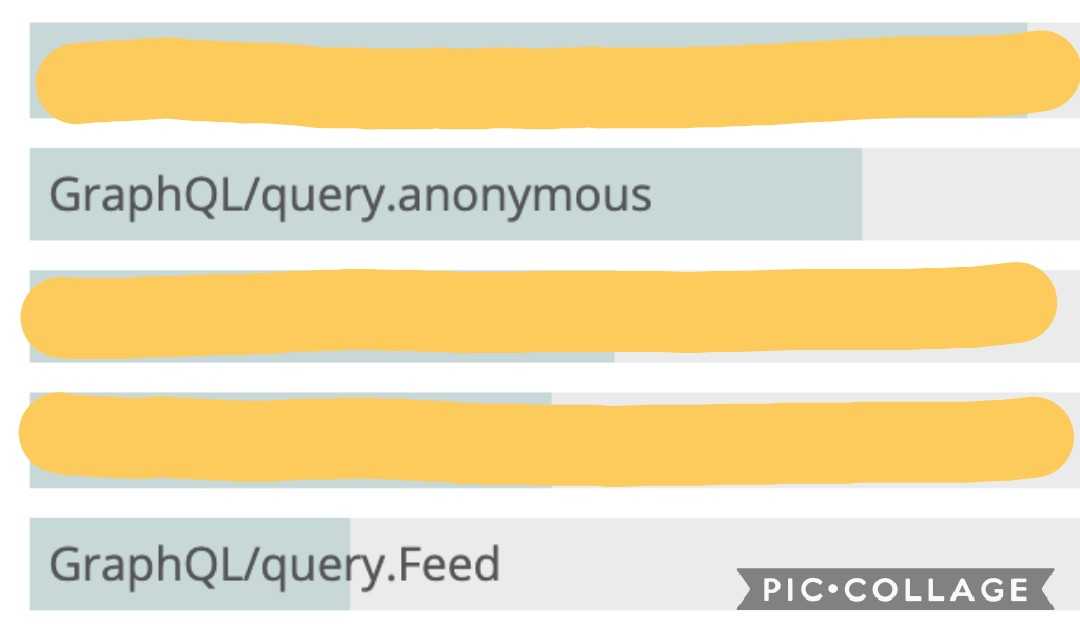
And the result will be like this.

One caveat, though. See the GraphQL/query.anonymous? That's what happens to the queries without names. If you're not in total control of the queries you receive, you can't be sure if they will all be named, or to take it furthur, named as expected.
In our case, the end users of our GraphQL API are our Android team and iOS team. Currently, of the 10-ish queries they send, only one is named (which is the .Feed we see above). It's an easy operation to add names to the routes, but still it requires coordination and cross-team cooperation. But all we want is simple (or so I think): to monitor the routes with better granularity.
What if we instrument our NewRelic agent so that it automatically parses the query's fields as transaction name?
Tracking GraphQL Performance by Query: The Interesting Way
That's what we ended up: making a customized NewRelic plugin for graphql-ruby library.
Basically, our custom plugin inherits from the original built-in GraphQL::Tracing::NewRelicTracing class and overwrites its platform_trace method. In the method two things happen:
- The transaction name is set to the query's first-layer fields.
- The full query string is recorded as a custom attribute (that will be shown inside a report), which is a workaround to the annoying 255-byte limit of the query column provided by default in the request section.
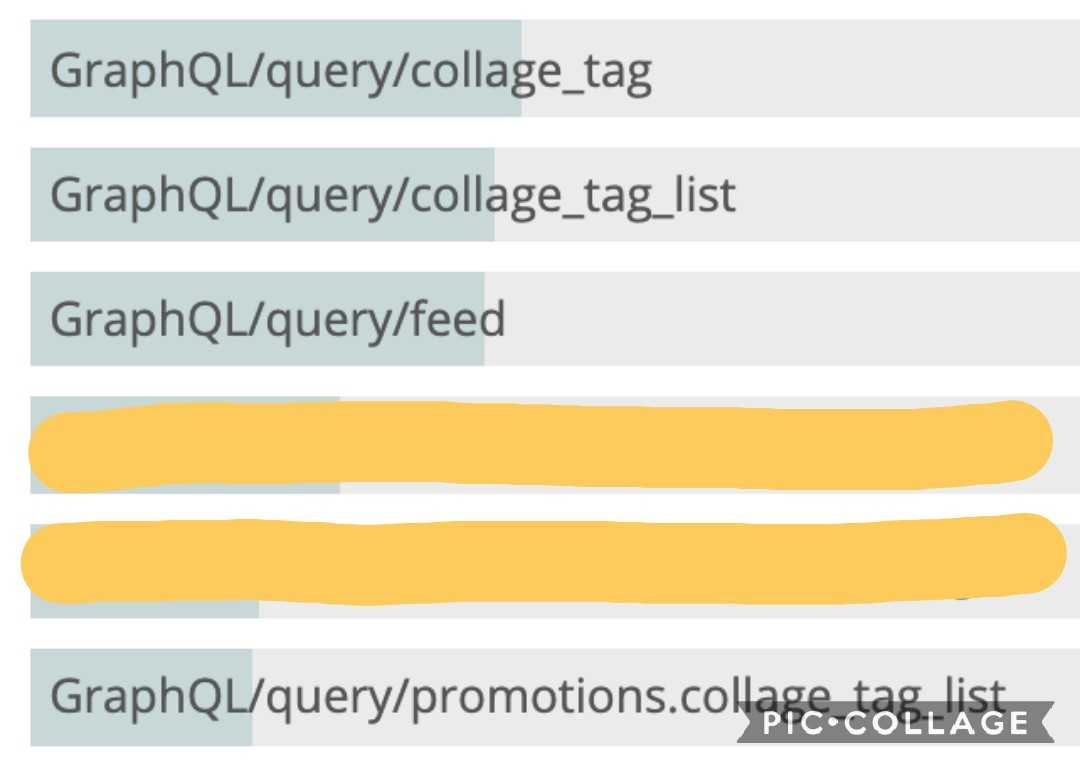
And the result looks like this:

Inside a transaction trace:

Final Note
GraphQL queries, by nature, are dynamically formed, and it's up to you to decide how to group them into useful units. The method provided below is only one possiblity, which suits our business logic. Feel free to tweak them furthur (and let me know if you do!).
Voila, a day's work done. Now we have our analysis tool polished, it's time to DO the analysis and optimize things! Stay tuned!